EDA Studio, a local tool for exploratory data analysis
By Elad Oz-Cohen in Python Data Tools
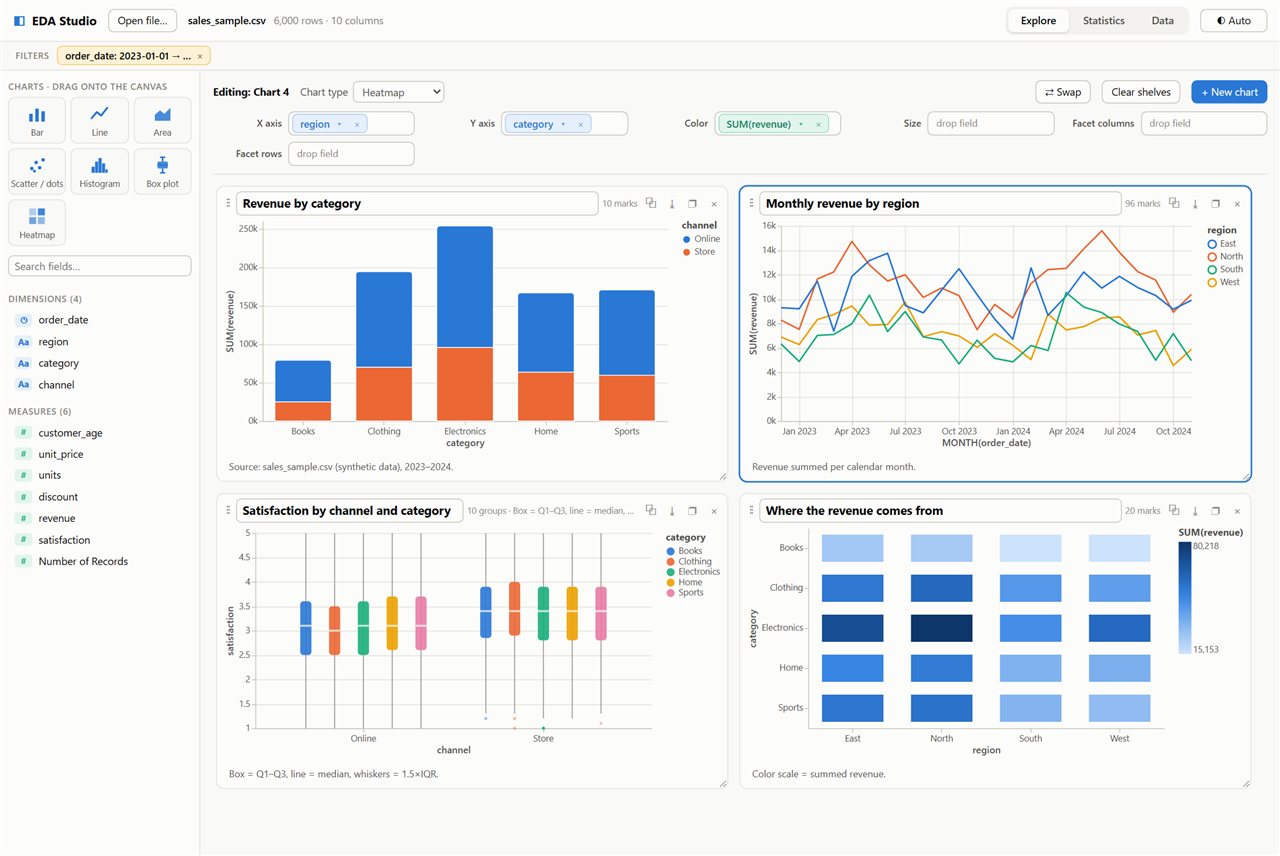
EDA Studio is a tool I built for getting to know a dataset quickly. You drag fields onto a canvas to build charts, the way you would in Tableau, and then run a statistical test on the same data without leaving the window, the way you would in Jamovi. I built it with AI assistance (Claude Code).
Why I built it
In a notebook, the loop of load, plot, tweak and plot again is slow when you just want to understand a dataset. In EDA Studio nothing is charted automatically. You decide what goes on each axis, and the numbers are computed in a database engine, so a few million rows still feel fast.
What it does
Explore
- A canvas of charts: bar, line, area, scatter, histogram, box plot and heatmap
- Shelves for the X and Y axes, color, size and facets, and a click on a field changes its aggregation, date part or bin size
- Global filters that apply to every chart, a title and footnote on each chart, and export to PNG
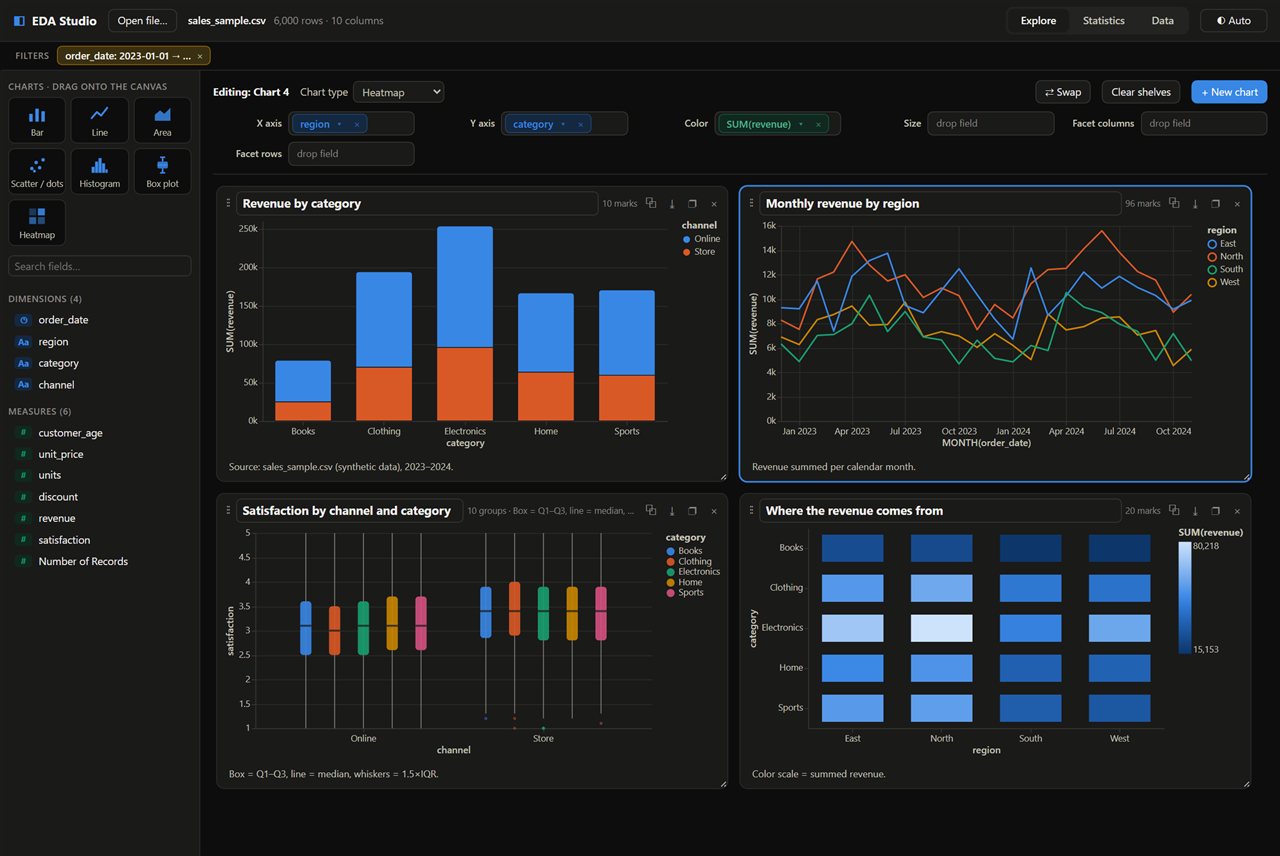
- Light and dark themes
Statistics
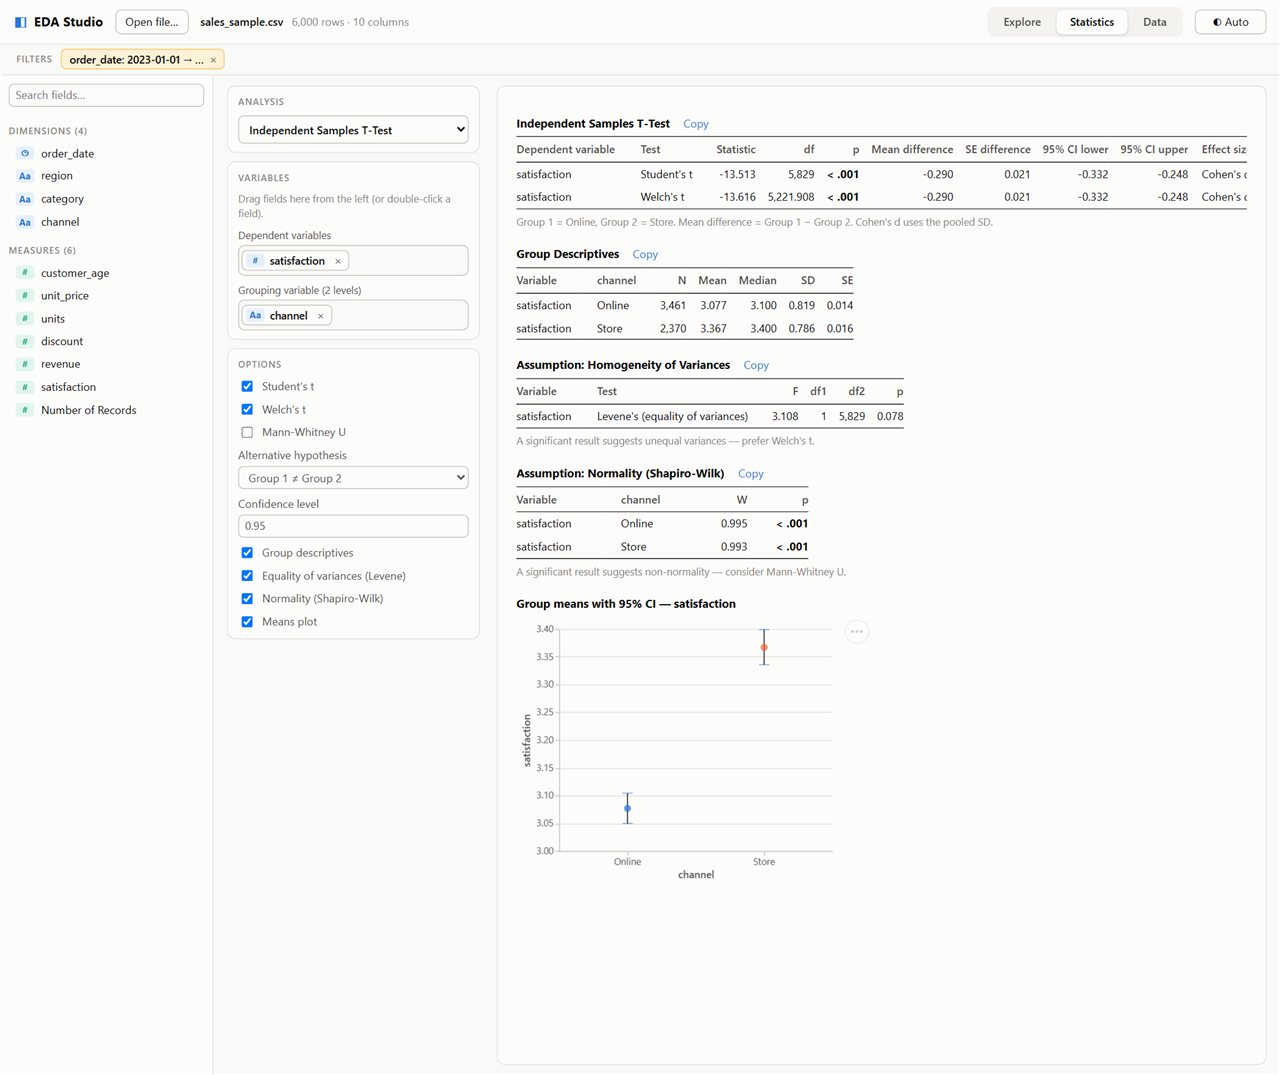
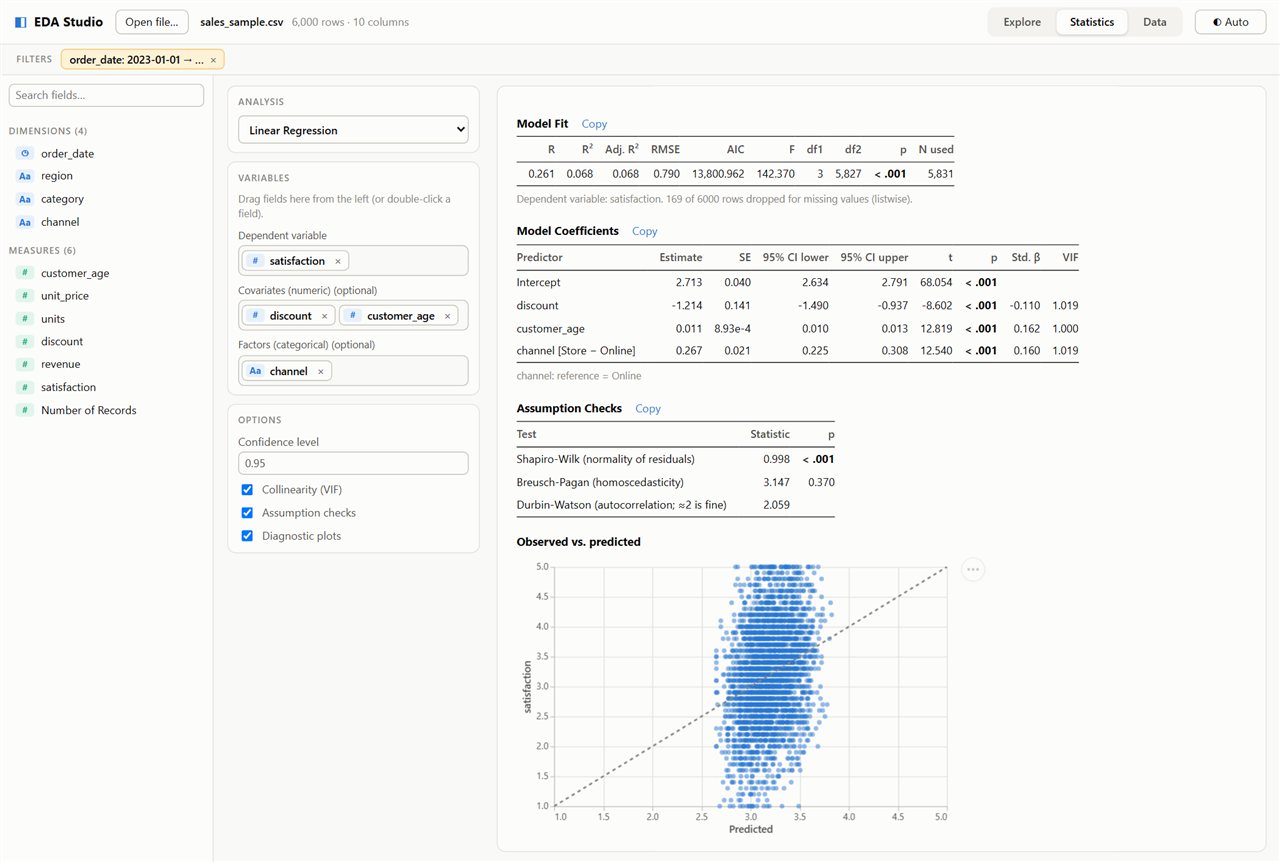
- Descriptive statistics, t-tests (Student, Welch, Mann-Whitney, Wilcoxon), one-way ANOVA with post hoc tests, correlation matrices and linear regression
- Assumption checks and diagnostic plots
- APA-style tables that copy straight into Excel
Data
- CSV, JSON, Parquet and Excel files, including Hebrew CSVs in Windows-1255
- A profile of every column: type, missing values, range and spread
How it is built
The app runs locally, and your data never leaves your machine. The backend is Python with FastAPI and DuckDB, and the charts are drawn with Vega-Lite. The statistics are checked against scipy and statsmodels, and there is a test suite behind them. It is packaged as a portable folder that needs no installer.
The code is on GitHub.
- Posted on:
- November 16, 2026
- Length:
- 2 minute read, 294 words
- Categories:
- Python Data Tools
- See Also: